The upsetting scenes in Ukraine sent shockwaves through us all as individuals and also through global stock markets. However, as in all periods of crisis, investors should try avoid making rash decisions in the heat of the moment. Here is some historic data and analysis which can help you do just that.
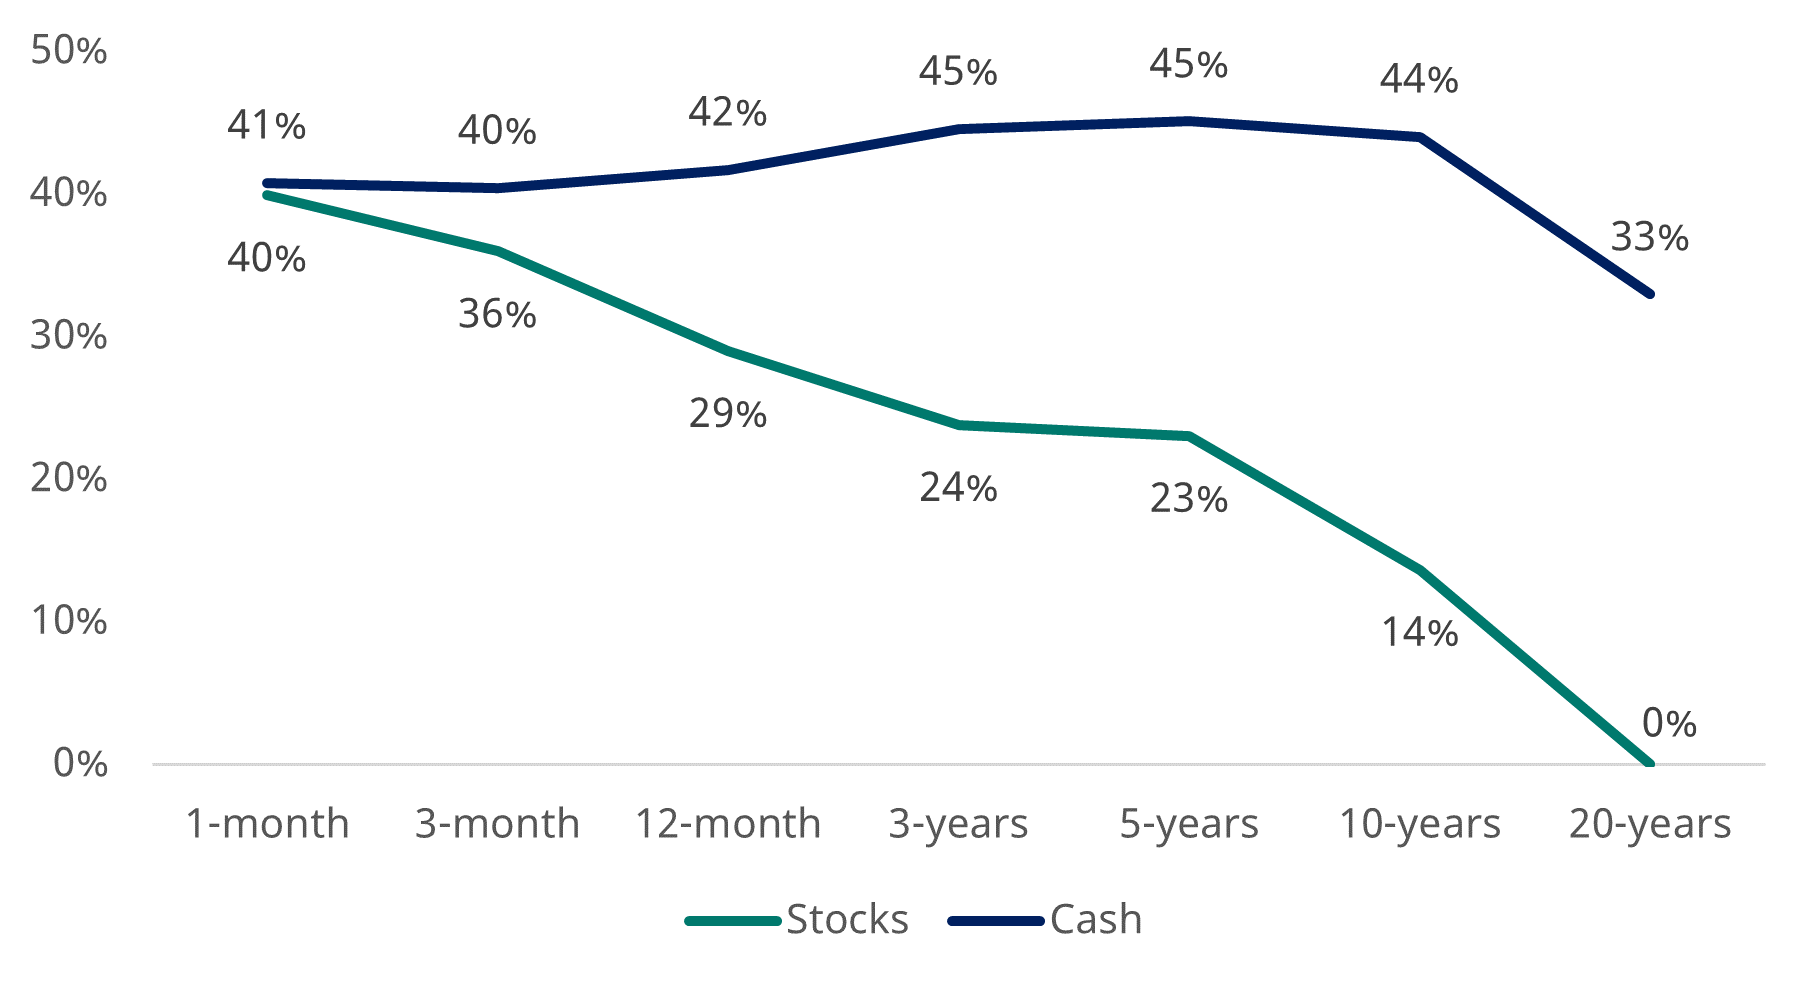
Stock market investing is very risky in the short run but less so in the long-run – unlike cash
Percentage of time where investors would have lost money in inflation-adjusted terms
Past performance is not a guide to the future and may not be repeated.
Stocks represented by Ibbotson® SBBI® US Large-Cap Stocks, cash by Ibbotson® SBBI® US (30-Day) Treasury Bills. Data January 1926-January 2022. Source: Morningstar Direct, accessed via CFA institute.
Using almost 100 years of data on the US stock market, we found that, if you invested for a single month, you would have lost money 40% of the time in inflation-adjusted terms (specifically that’s 460 of the 1,153 months in our analysis).
However, if you had invested for longer, the odds would shift dramatically in your favour. On a 12-month basis, you would have lost money slightly less than 30% of the time. Importantly, 12-months is still the short-run when it comes to the stock market. You’ve got to be in it for longer.
On a five-year horizon, that figure falls to 23%. At 10 years it is 14%. And there have been no 20-year periods in our analysis when stocks lost money in inflation-adjusted terms.
Losing money over the long run can never be ruled out entirely and would clearly be very painful if it happened to you. However, it is also a very rare occurrence.
In contrast, while cash may seem safer, the chances of its value being eroded by inflation are much higher. And, as all cash savers know, recent experience has been even more painful. The last time cash beat inflation in any five-year period was February 2006 to February 2011, a distant memory. Nor is that something that’s expected to change any time soon.
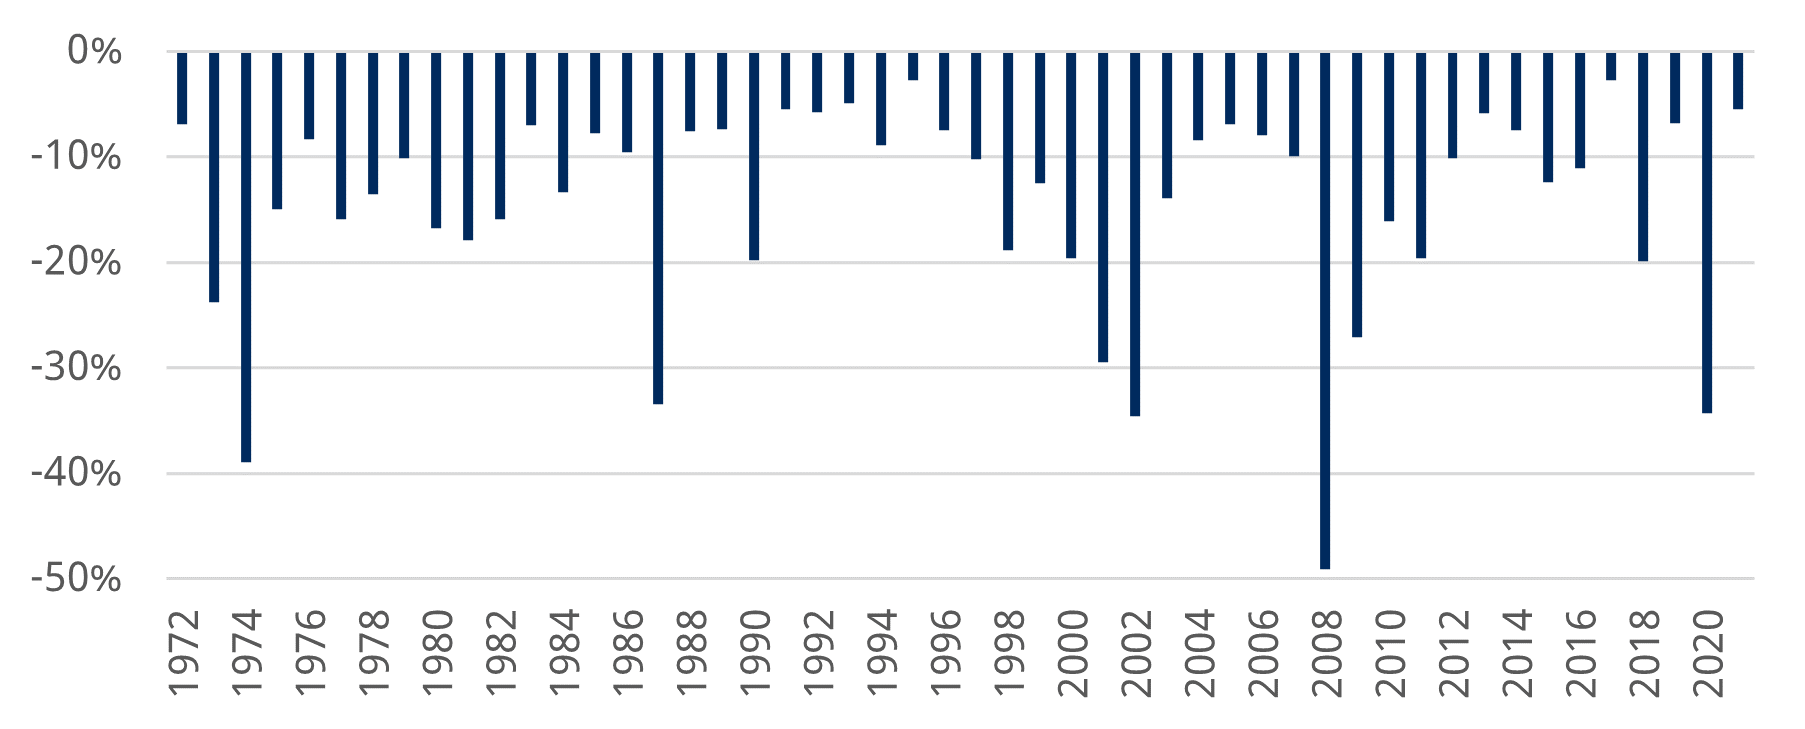
10%+ falls happen in more years than they don’t – but long term returns have been strong
The biggest stock market falls of each calendar year
Past performance is not a guide to the future and may not be repeated.
Source: Refinitiv and Schroders. Data to 31 December 2021 for MSCI USA index.
In the days after Russia’s invasion of Ukraine, global stock markets had fallen by 10% from their earlier peak.
10% may feel like a big fall but it’s actually a regular occurrence. The US market has fallen by at least 10% in 28 of the past 50 calendar years – that’s more often than not. In the past decade, this includes 2012, 2015, 2016, 2018 and 2020.
The key point to note is that despite these regular bumps along the way, the US market has returned 11% a year over this 50 year period overall.
The risk of near term loss is the price of the entry ticket for the long term gains that stock market investing can deliver.
Bailing out after big falls could cost you your retirement
Bad news and uncertainty of any sort can cause volatility in markets. When that happens, it can become much harder to avoid being influenced by our emotions – and be tempted to ditch stocks and dash for cash.
However, our research shows that, historically, that would have been the worst financial decision an investor could have made. Switching from the stock market to cash after an initial market fall pretty much guarantees that it would take a very long time to recoup your losses.
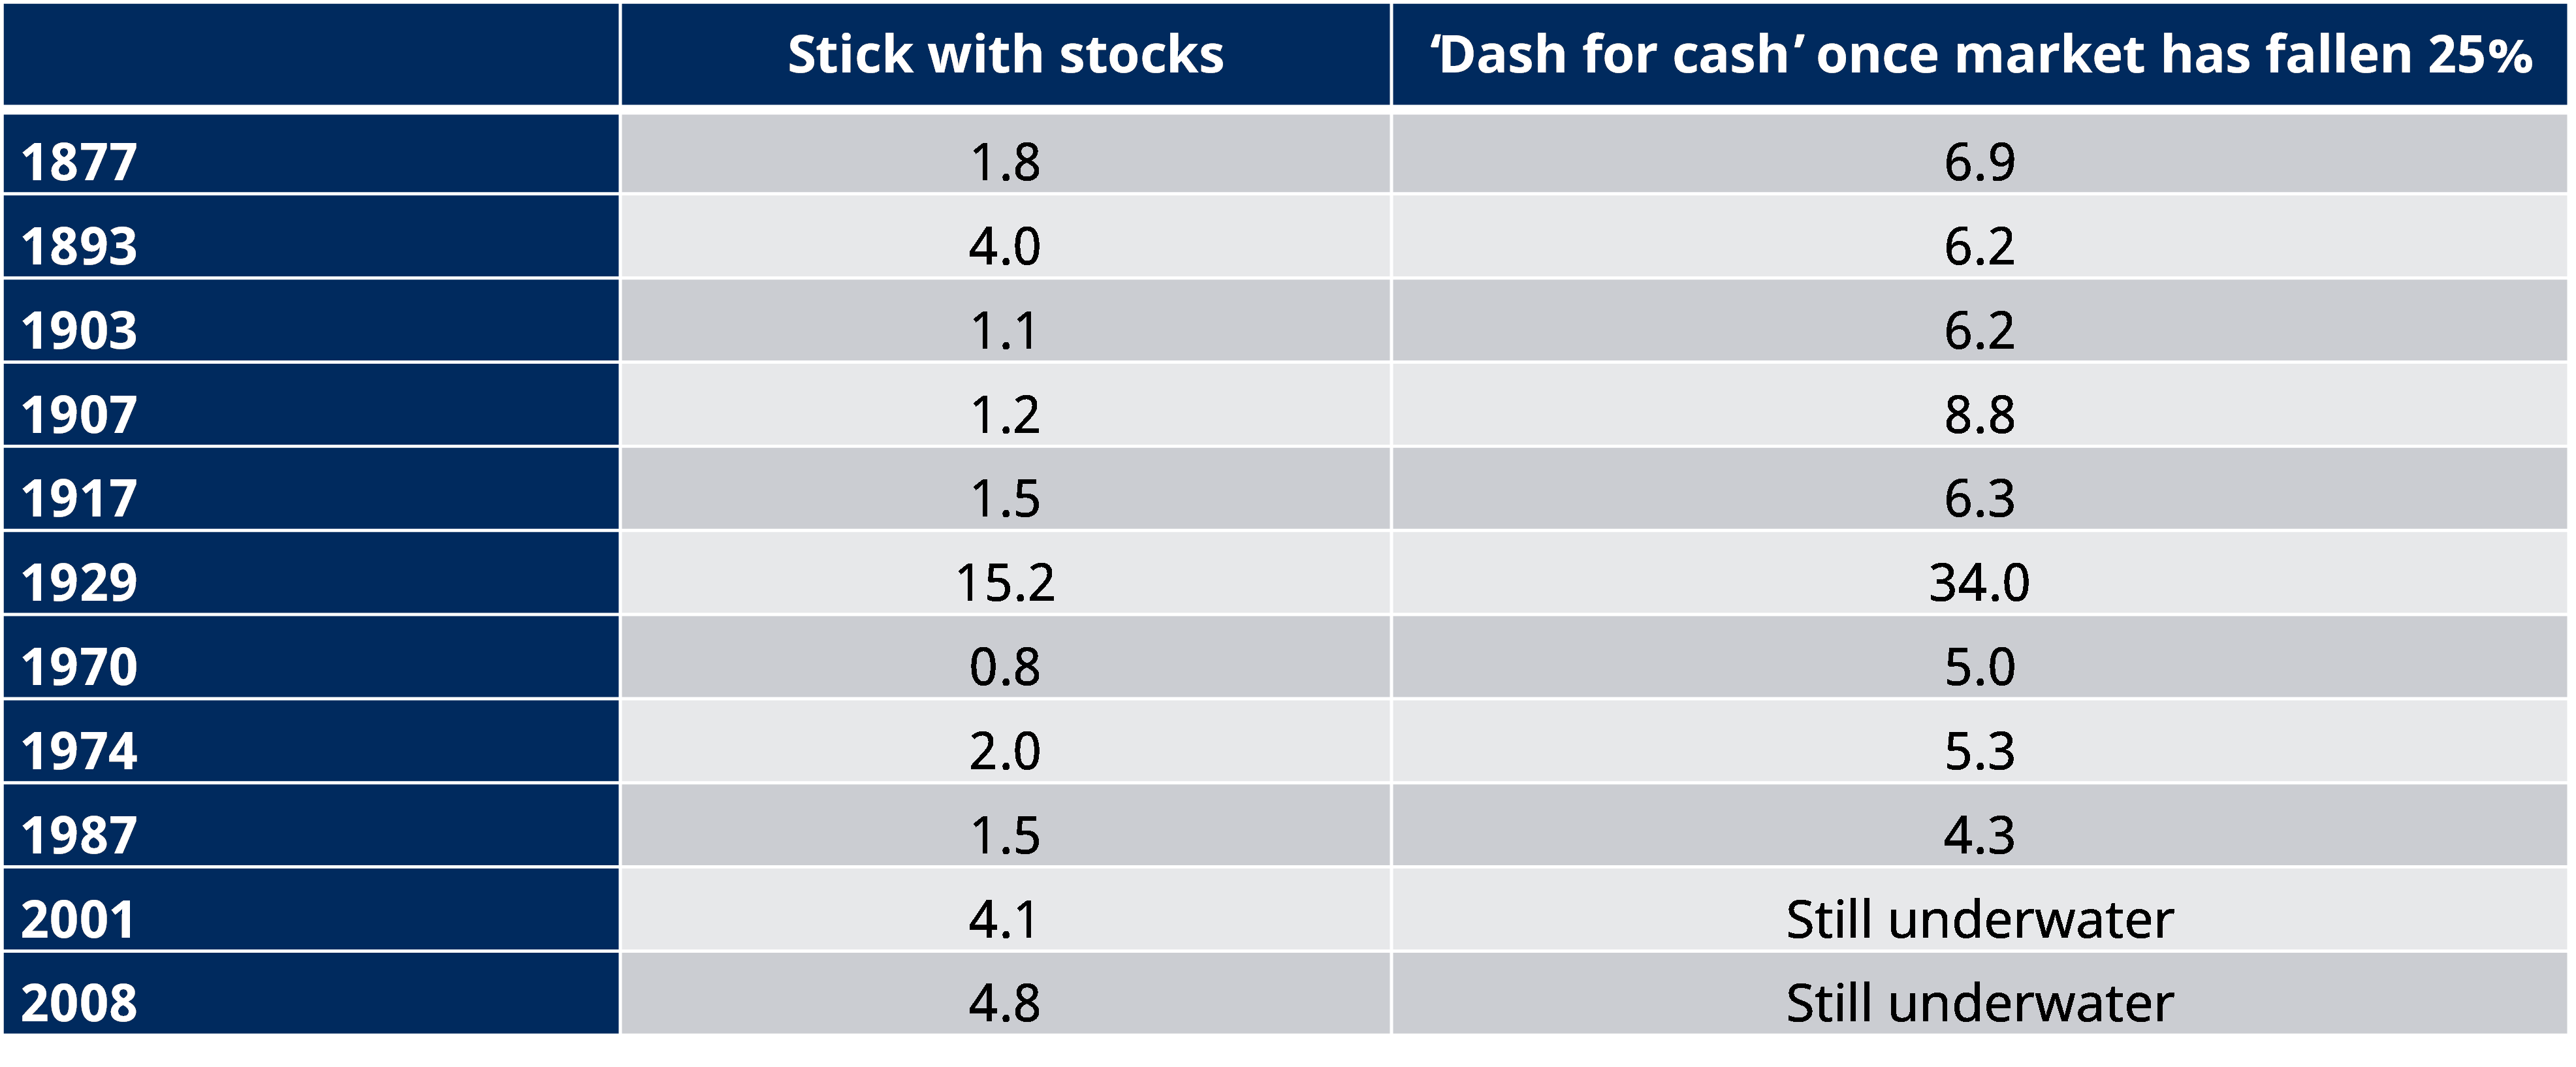
For example, investors who shifted to cash in 1929, after the first 25% fall of the Great Depression, would have had to wait until 1963 to get back to breakeven. This compares with breakeven in early 1945 if they had remained invested in the stock market. And remember, the stock market ultimately fell over 80% during this crash. So, shifting to cash might have avoided the worst of those losses during the crash, but still came out as by far the worst long-term strategy.
Similarly, an investor who shifted to cash in 2001, after the first 25% of losses in the dotcom crash, would find their portfolio still underwater today.
The message is overwhelmingly clear: a rejection of the stock market in favour of cash in response to a big market fall would have been very bad for wealth over the long run.
Giving up on the stock market after big falls can be a bad financial decision
Number of years to recoup initial losses
Past performance is not a guide to the future and may not be repeated.
Source: Federal Reserve Bank of St. Louis, Robert Shiller, Schroders. Monthly cash return 1934-2020 based on 3-month Treasury bill, secondary market rate; 1920-1934 based on yields on short-term United States securities; 1871-1920 based on 1-year interest rate. 1871-1920 data only available annually so a constant return on cash has been assumed for all months during this period. Other data is monthly. All analysis is based on nominal amounts.
Periods of heightened fear have been better for stock market investing than might have been expected
Escalating tensions between Russia and Ukraine have sent the stock market’s “fear gauge”, the Vix index, higher. The Vix is a measure of the amount of volatility traders expect for the US’ S&P 500 index during the next 30 days.
It has recently risen to a level of 32 on Monday 28 February, well above its average since 1990 of 19, and steeply higher than its start of year level of 17. It’s not hard to imagine a scenario where it moves even higher in the coming days as events continue to unfold.
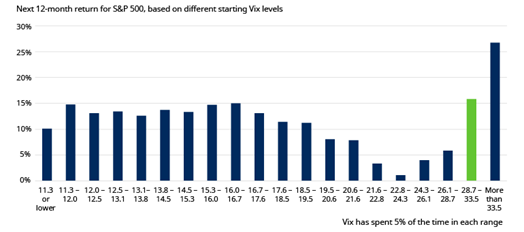
However, rather than being a time to sell, historically, periods of heightened fear have been when the brave-hearted have earned the best returns. On average, the S&P 500 has generated an average 12-month return of over 15% if the Vix was between 28.7 and 33.5. And more than 26% if it breached 33.5.
Markets have performed well when the Vix has been around the current level of 30, or higher
Past performance is not a guide to the future and may not be repeated.
Formally, each range includes the upper limit but not the lower limit e.g. 11.3 – 12.0 captures entries where the Vix is greater than 11.3 but less than or equal to 12.0. Data covers 2 January 1991 to 24February 2022. Source: Schroders, Refinitiv.
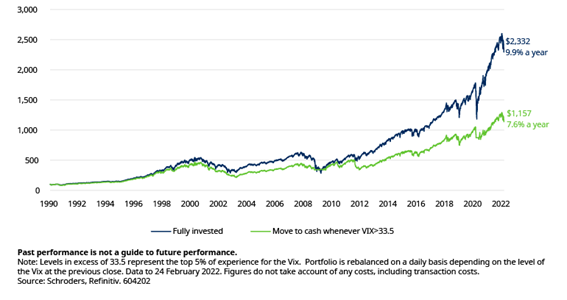
We also looked at a switching strategy, which sold out of stocks (S&P 500) and went into cash on a daily basis whenever the Vix entered this top bucket, then shifted back into stocks whenever it dipped back below. This approach would have underperformed a strategy which remained continually invested in stocks by 2.3% a year since 1991 (7.6% a year vs 9.9% a year, ignoring any costs).
A $100 investment in the continually invested portfolio in January 1990 would have grown to be worth twice as much as $100 invested in the switching portfolio.
Growth of $100 fully invested in stocks vs switch to cash with Vix higher
As with all investment, the past is not necessarily a guide to the future but history suggests that periods of heightened fear, as we are experiencing at present, have been better for stock market investing than might have been expected.
Important information
Marketing material for professional clients only, not for onward distribution. Any reference to sectors/countries/stocks/securities are for illustrative purposes only and not a recommendation to buy or sell any financial instrument/securities or adopt any investment strategy. The material is not intended to provide, and should not be relied on for, accounting, legal or tax advice, or investment recommendations. Reliance should not be placed on any views or information in the material when taking individual investment and/or strategic decisions. Past performance is not a guide to future performance and may not be repeated. The value of investments and the income from them may go down as well as up and investors may not get back the amounts originally invested. Exchange rate changes may cause the value of investments to fall as well as rise. Information herein is believed to be reliable but Schroders does not warrant its completeness or accuracy. This document may contain “forward-looking” information, such as forecasts or projections. Please note that any such information is not a guarantee of any future performance and there is no assurance that any forecast or projection will be realised. Schroders will be a data controller in respect of your personal data. For information on how Schroders might process your personal data, please view our Privacy Policy available at www.schroders.com/en/privacy-policy/ or on request should you not have access to this webpage. For your security, communications may be recorded or monitored. This document is issued in March 2022 by Schroder Investment Management Limited, 1 London Wall Place, London EC2Y 5AU. Registration No. 1893220 England. Authorised and regulated by the Financial Conduct Authority. UK004147.
The information, materials or opinions contained on this website are for general information purposes only and are not intended to constitute legal or other professional advice and should not be relied on or treated as a substitute for specific advice of any kind.
We make no warranties, representations or undertakings about any of the content of this website; including without limitation any representations as to the quality, accuracy, completeness or fitness of any particular purpose of such content, or in relation to any content of articles provided by third parties and displayed on this website or any website referred to or accessed by hyperlinks through this website.
Although we make reasonable efforts to update the information on this site, we make no representations, warranties or guarantees whether express or implied that the content on our site is accurate complete or up to date.
By Duncan Lamont, Head of Strategic Research, Schroders
Duncan writes actionable, thought leadership research to offer insights which help Schroders’ clients make better investing decisions. Prior to joining Schroders seven years ago, Duncan was a principal in the Global Asset Allocation team at Aon Hewitt, where he was responsible for the development of the firm’s long term strategic capital market assumptions, and driving its medium term asset allocation views across the full range of traditional and alternative asset classes. He also had spells as an assistant director at a corporate finance boutique and as a trainee investment consultant. Duncan is a CFA charterholder with a Masters in Mathematics, Operational Research, Statistics and Economics from the University of Warwick, specialising in actuarial and financial mathematics.
Read more articles by this author
Be the first to hear news and insights from Embark Group
Sign up to receive updates from Embark Group and its businesses. You can unsubscribe at any time using the link at the bottom of our emails, and we promise never to pass your details to a third party. Please consult our Privacy Notice for more information.